Detection
Introduction
Cyclic voltammetry
×
Cyclic voltammetry
Cyclic voltammetry (CV) is a method of applying potential in working electrode (WE) through reference electrode (RE) to obtain the direction of the redox current from a counter electrode (CE). A cyclic scanning procedure is performed from a starting potential to a terminal potential at a fixed scanning rate of bias increasing, and then decreasing bias to the starting potential at the same rate. Therefore a CV curve could be drawn with measured current and its given bias. With the surface status changes including surface immobilization and DNA attachments, clear differences of CV curves could be observed in peak current and peak bias shift.
For testing the result, we used cyclic voltammetry as an electrochemistry method.
Experiment
Surface Cleaning
After the chip package is completed, electrodes could be cleaned by cyclic voltammetry. The first wash was carried out at one M NaOH at a speed of 0.3 V / s in the range -0.two to + 0.8 V, followed by a second wash in 0.5 M H2SO4 at a speed of 0.3 V / s and a range of -0.two5 to + one.75 V.
The connection between Au and capture probe
×
The connection between Au and capture probe
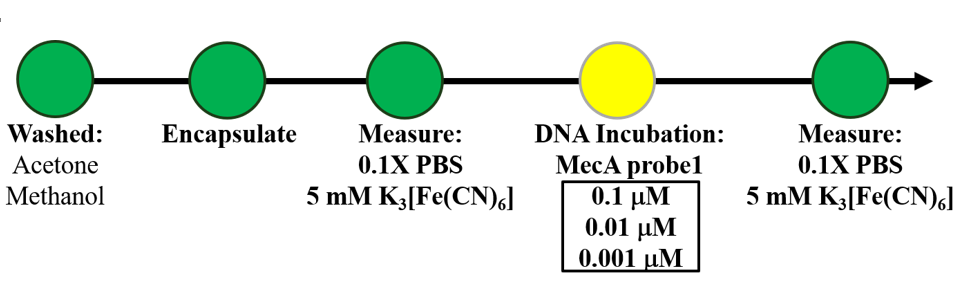
- Incubation Condition:
- DNA: Cy5-MecA-thiol group (-SH)
- Temperature and time:25℃ 16h
- Measurement Condition:
- Scan range: -0.5 to +0.8 V
- Scan rate: 0.1 V/S
- Scan times: 30 cycles


Fig.1 The CV plot of capture probe connected with Au electrode
There are two curves in each plot. The black curve shows the original state of chips. And red curve shows the state of chips that were added 0.1/0.01/0.001 μM capture probes. So here we can see a significant difference between two curves in each plot.
We know that DNA is negative charged. Therefore, when capture probes connected with the electrodes, the negative charge would be elevated, and the curves would be inward such as red curves, describing that DNA were connected to the electrode successfully.

Table.1 The table show the difference between the concentration of capture probe
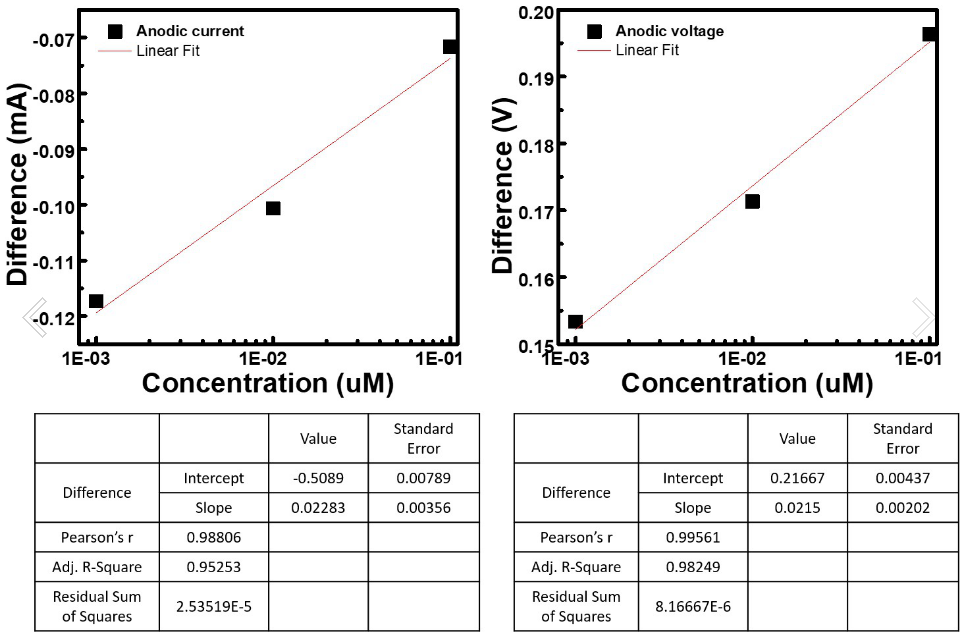
Fig.2 The two plot show the linear fit between concentration and difference (V/mA)
The connection between graphene and capture probe
To obverse whether capture probes connected with graphene or not, we use the fluorescence microscope to take the picture of chip.The red spots in the picture are the capture probes modified with Cy3. Single probes are not easy to be seen since the small size, therefore, the bigger spots in the picture show the situation that DNA entangled together.
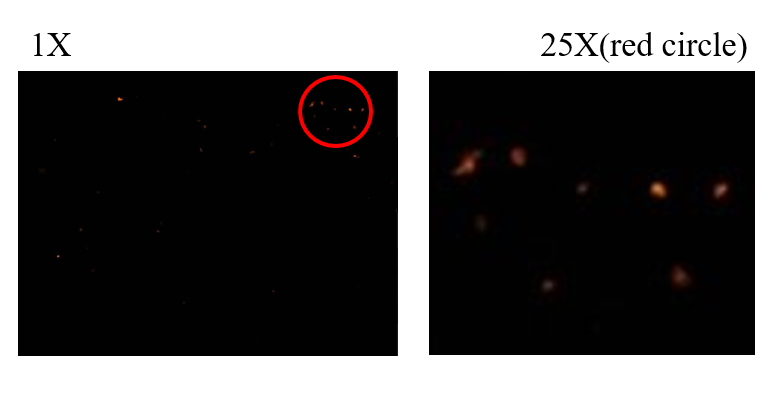
Fig.3 The fluorescent picture of capture probe connected with the graphene electrode
The connection between target DNA and capture probe
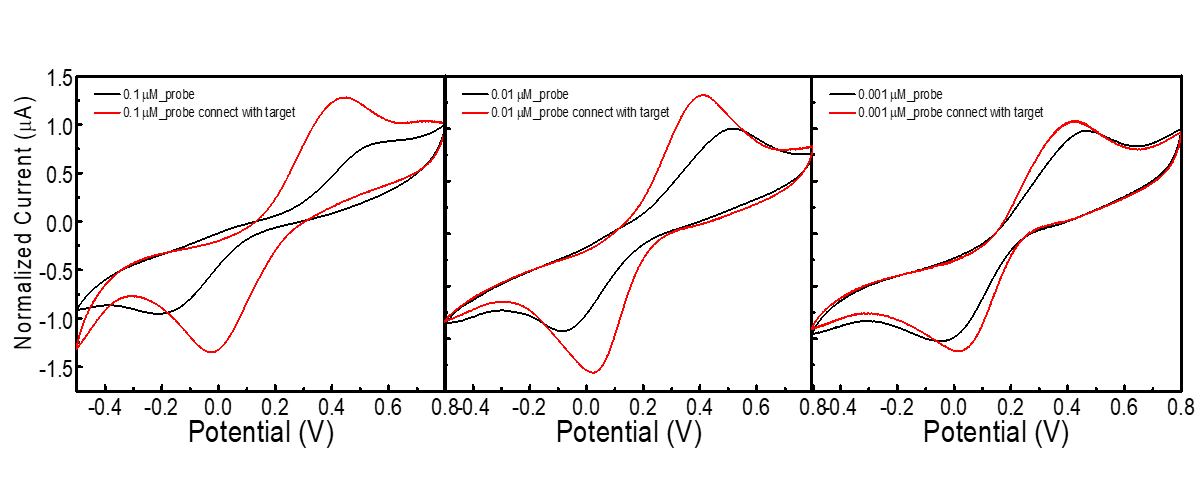
Fig.4 The CV plot of target DNA connected with the capture probes in Au electrode
There are two curves in each plot. The black curve shows the state of a chip which was connected with capture probes. And red curve shows the state of chips that were added 0.1/0.01/0.001 μM target DNA. So here we can see a significant difference between two curves in each plot.
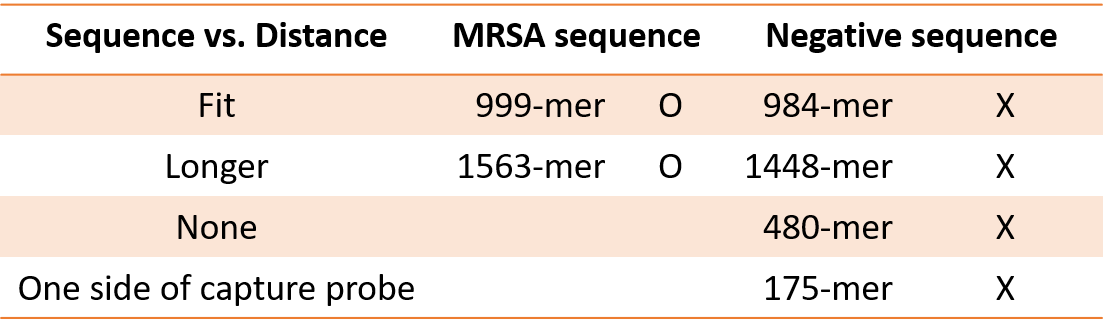
Table.2 The table of target DNA connected with two captures in our chip
We divided the target DNA into three types according to the connection method, and measured the negative target DNA length as long as positive but the sequence is not the same. It was found that only the MRSA sequence length is above 1000-mer, and the resistance value of about 20K is measured, indicating that the power is on, that is, DNA bridge is forming, while the Negative target DNA length is approximate 1000-mer, but because it does not match the probe sequence, the resistance cannot be measured. This result indicates that our device is specific.
Discussion
We got three methods in the detection part, there were cyclic voltammetry, fluorescence microscope and three-meter electric meter. The principles used in these three methods are different, but all of these methods can quickly get the experimental results. The reason for using the three methods is mainly because graphene is unstable in electrochemical measurement. In the future, we will use other materials instead.
Conclusion
The entire project can be divided into three parts of detections. First of all is the connection of the probes with the electrodes, second is the one-side connection of the probes to the target DNA, lastly is the both-side connection of the probes to the target DNA. In our latest progress, we successfully determined that the Au electrodes can be connected to capture probes and that the capture probes on the Au electrodes are also able to capture target DNA through electrochemistry method. Next, we observed the result under a fluorescence microscope to determine whether capture probes successfully connected to the graphene electrodes. Finally, we measured the electric resistance with a three-meter electric meter to confirm whether if our target DNA successfully connected to both sides of the capture probes, setting up an electric circuit. Above all, the results of our experiments strongly support the feasibility of our project.